Pet Ownership Statistics
Highlights. Two out of every three American homes includes a pet, and 393.3 million pets live in the United States; dogs, cats, and fish are the most popular pets, though preferences for breeds and types of animals vary across regions.
- 85 million or 67% of American homes include a pet.
- 95% of American pet owners consider their pets to be family members.
- Freshwater aquarium fish are the most popular pet, with 139.3 million of them nationwide.
- Americans spend $1 billion each year on pet insurance.
- Pet ownership has increased 20% since 1988.
Pet Ownership Details
Pet Ownership in the United States has risen steadily in recent decades, with a higher percentage of households owning pets today compared to 40 years ago.
-
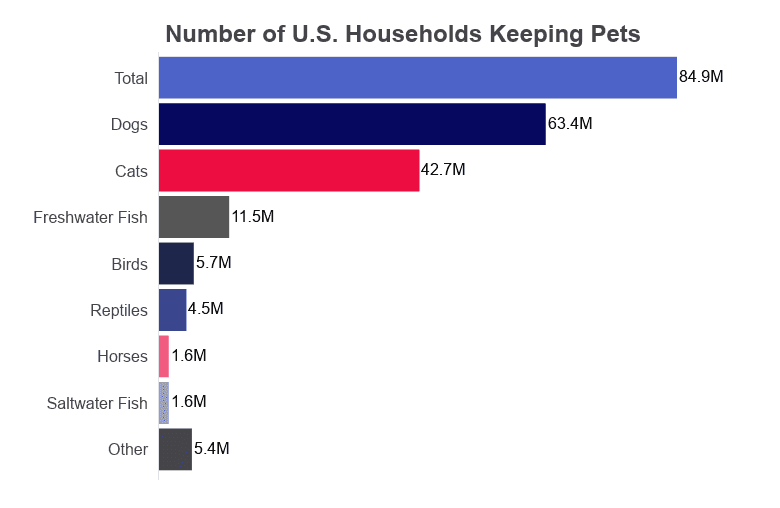
- 84.9 million or 67% of American households own at least one kind of pet.
- 63.4 million or 53% of American households own dogs.
- Most dog-owning households have one dog.
- 42.7 million or 35.7% of households own cats.
- Cat owning households keep an average of 2 cats each.
- 11.5 million or 9.6% of households own freshwater fish.
- Freshwater fish owners keeps an average of 12 fish.
- 5.7 million or 4.8% keep birds.
- Between 3 and 4 birds live in the average bird-owning household.
- 4.5 million or 3.8% have reptiles.
- Each reptile-owning households keeps an average of 2 reptiles.
- 1.6 million or 1.3% keep horses.
- Horse owners keep between 4 and 5 horses per household.
- 1.6 million or 1.3% keep saltwater fish.
- Households with saltwater fish keep between 11 and 12 fish on average.
- 5.4 million or 4.5% have another type of small animal as a pet.
- These households keep between 2 and 3 pets.
Pet Ownership Among Generations
Pet ownership appears to be most popular among younger adults. The eldest of Generation Z are just now reaching adulthood. Wtih comparatively little data available regarding Generation Z and pet ownership, statistical meaning is doubtful.
-
-
- 73% of Millennials, born between 1981 and 1994, own pets.
- 89% of home-owning Millennials also own pets.
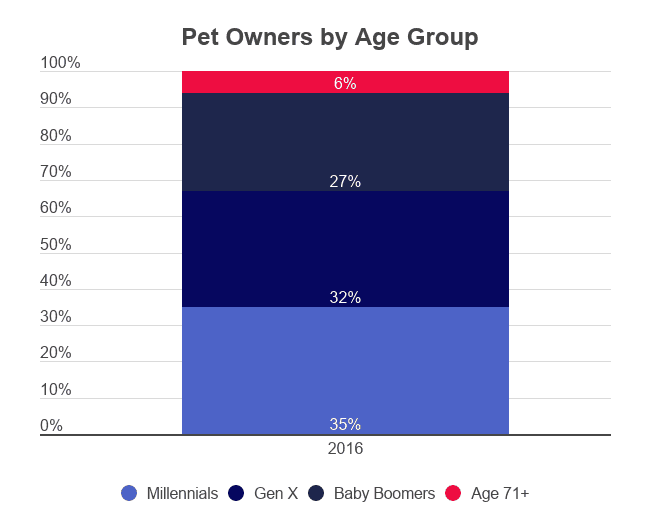
- 35% of all pet owners are Millennials.
- 32% of pet owners are Generation X, born between 1965 and 1981.
- 27% of pet owners are Baby Boomers, born between 1946 and 1964.
- Just 6% of pet owners are in the Silent Generation.
-
Historical Pet Ownership
While it appears pet ownership among households has stagnated, there are significantly more pet owners now than there were 30 years ago. This increase may be partially explained by the growing number of medical specialists and counselors espousing the health benefits of companion animals.
- There’s been a 20% increase in pet ownership since 1988, when just 56% of American households owned a pet.
- In the 20 years between 1988 and 2008, pet ownership increased among U.S. households by 11%, or six percentage points.
- In the five years between 2008 and 2013, pet ownership rose 10%, or a further 6 percentage points.
- In the 25 years between 1988 and 2013, household pet ownership grew 0.9% annually.
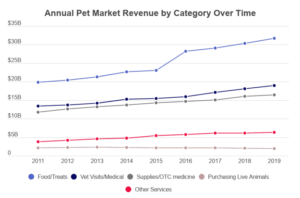
- Since 2000, dog ownership has risen steadily by 21.9%.
- Cat ownership has cycled up and down but, overall, has increased 29% since 2000.
- Pet fish ownership has declined 12.4% since 2000.
- Bird owners increased slightly, rising 8.4% between 2000 and 2018.
Pet Ownership Among States
Pet ownership not only varies across states, but the popularity of different breeds varies from one state to the next. Wyoming’s high rate of pet ownership but relatively low rate of dog and cat ownership is likely due to the popularity of horses in this region.
- In 80% of states, over half of households include at least one pet.
- Wyoming households are the most likely to include pets.
- Households in Montana are the most likely to include dogs.
- Households in West Virginia are the most likely to include cats.
- Kentucky, Missouri, Mississippi, Alabama, Tennessee, Texas, and Oklahoma are among the top ten states in dog ownership.
- Washington, Kentucky, Indiana, and New Hampshire are among the top ten states in cat ownership.
- Rhode Island households are the least likely to include cats and the least likely to include any kind of pet.
- Households in Connecticut are the least likely to include a dog.
| State | % of Pet-Owning Households | |||
|---|---|---|---|---|
| All | Dogs | Cats | ||
| 1 | Wyoming | 71.8% | 36.0% | 30.0% |
| 2 | West Virginia | 70.7% | 50.0% | 38.0% |
| 3 | Vermont | 70.0% | 28.3% | 44.6% |
| 4 | Idaho | 69.9% | 33.3% | 34.4% |
| 5 | Indiana | 69.2% | 49.4% | 37.5% |
| 6 | Arkansas | 69.0% | 51.6% | 34.8% |
| 7 | Mississippi | 65.5% | 51.0% | 29.1% |
| 8 | Oklahoma | 65.0% | 47.7% | 28.4% |
| 9 | Kentucky | 64.1% | 46.5% | 32.2% |
| 10 | North Dakota | 63.7% | 44.3% | 24.8% |
| 11 | Missouri | 63.5% | 45.1% | 32.2% |
| 12 | Maine | 63.5% | 35.9% | 43.6% |
| 13 | Kansas | 62.8% | 43.1% | 32.4% |
| 14 | Washington | 62.7% | 42.8% | 30.5% |
| 15 | Ohio | 62.4% | 37.9% | 30.7% |
| 16 | Michigan | 62.4% | 41.9% | 31.2% |
| 17 | South Carolina | 62.0% | 45.3% | 25.2% |
| 18 | Montana | 61.9% | 51.9% | 22.8% |
| 19 | Tennessee | 61.7% | 47.0% | 30.9% |
| 20 | Pennsylvania | 60.6% | 38.9% | 28.9% |
| 21 | New Mexico | 60.1% | 39.4% | 25.2% |
| 22 | Hawaii | 60% | 43% | * |
| 23 | Alabama | 59.8% | 46.9% | 26.1% |
| 24 | Iowa | 59.4% | 36.3% | 35.6% |
| 25 | Oregon | 59.2% | 37.8% | 30.0% |
| 26 | Wisconsin | 59.0% | 33.6% | 32.4% |
| 27 | North Carolina | 58.6% | 41.3% | 26.5% |
| 28 | Utah | 58.5% | 36.2% | 24.7% |
| 29 | Texas | 58.2% | 43.4% | 26.5% |
| 30 | Arizona | 58.0% | 43.0% | 26.4% |
| 31 | Delaware | 57.9% | 42.2% | 24.1% |
| 32 | Florida | 56.0% | 39.8% | 24.2% |
| 33 | Virginia | 55.5% | 35.6% | 23.9% |
| 34 | Louisiana | 54.4% | 38.3% | 19.0% |
| 35 | Minnesota | 54.0% | 35.5% | 26.5% |
| 36 | Nevada | 53.3% | 36.8% | 23.1% |
| 37 | California | 53.0% | 32.8% | 28.3% |
| 38 | New Hampshire | 51.8% | 23.7% | 36.4% |
| 39 | Nebraska | 51.3% | 47.1% | 30.9% |
| 40 | Georgia | 51.1% | 36.7% | 20.4% |
| 41 | Connecticut | 49.9% | 24.0% | 26.7% |
| 42 | New York | 49.7% | 27.0% | 21.1% |
| 43 | Massachusetts | 49.1% | 28.9% | 23.5% |
| 44 | Maryland | 48.6% | 30.2% | 18.6% |
| 45 | Illinois | 48.6% | 32.4% | 18.6% |
| 46 | New Jersey | 47.4% | 29.1% | 18.9% |
| 47 | Colorado | 47.2% | 27.1% | 20.0% |
| 48 | South Dakota | 46.4% | 32.1% | 26.6% |
| 49 | Rhode Island | 45.4% | 25.8% | 16.7% |
| Alaska | * | * | * | |
*Data point unavailable.
Pet Expenses
Cost of Owning a Pet
The pet industry is one of the largest in the world, with the majority of its $95 billion-dollar value coming from pet food. Historically, spending for pets seems unaffected by the economy’s performance. Pet owner spending has steadily increased in every area except the purchase of live animals. The latter data may be attributable to increased awareness of animal shelters and the benefits of pet adoption.
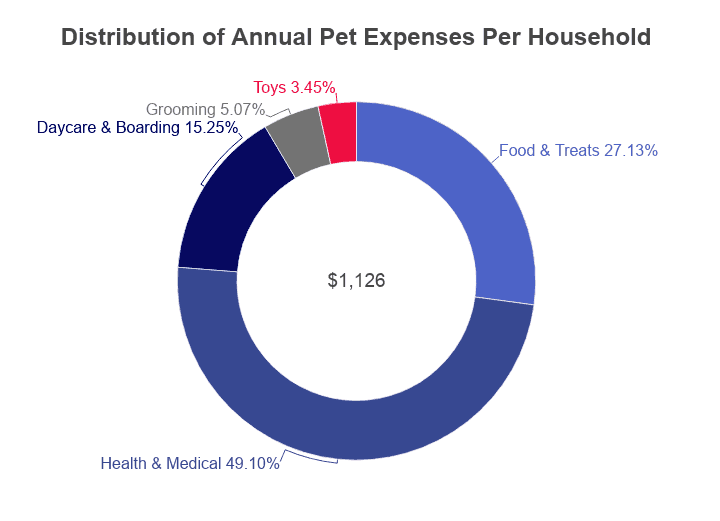
- $1,126 is how much the average pet owning household spends on their pets each year.
- 40% of that budget goes toward food and treats.
- Annual increases in food spending are often linked to specialty and boutique foods as well as dietary trends.
- 35.7% of annual pet spending goes toward medical and veterinary care.
- Most pet healthcare procedures cost more for dogs than cats.
- 68% of dog owners say they would keep their pet care spending the same no matter what happens with the economy.
Pet Healthcare
Pet health is the second-greatest expense to pet owners after their animals’ food. In general, mixed-breed animals have fewer health problems than purebreds. Some breeds are less prone to health problems than others. Some organizations, such as the Humane Society, help pet owners fund unexpected healthcare expenses.
- Some owners report spending more on their pet’s medical expenses than they do on their own healthcare costs.
- On average, dog owners take their dogs to a veterinarian 2.7 times per year.
- Bird owners take their pets to see a veterinarian the most, with an average of 3.1 vet visits per year.
- Surgery is the most expensive veterinary cost, averaging $474 for dogs, $245 for cats, and $75 for birds.
- Routine veterinary appointments cost an average of $75 more for dogs than they do for cats.
- An emergency veterinary visit costs dog owners $349 and cat owners $154 on average.